Google TabFM — Tabular Foundation Models (zero-shot forecasting)
Last reviewed: 19 September 2026
Édition française : Google TabFM — Modèles de fondation tabulaires (prévision zéro-shot)
You have 84 rows of data — not 84 million. Can a tabular foundation model still predict, with no training and no tuning? This article explains how these models work, what they change compared with a classic data-science project, and tests them on a real case in Senegal: photovoltaic production against the electricity consumption of a house in Badoudou, near Sokone.
What you will understand
- What a tabular foundation model is and why "tabular" means "spreadsheet": rows, columns, a target to predict.
- The difference between learning by training (classic project) and learning in context (foundation model), illustrated diagram by diagram.
- How TabFM from Google Research is built: attention by columns, compression of the rows, in-context learning Transformer.
- How these models behave on a real small Senegalese dataset of solar production, against XGBoost/Random Forest/a linear regression.
- When a foundation model is the right tool, and when it is not.
No prerequisite beyond secondary school: every notion is explained where it appears.
1. The problem: predicting well costs time, especially when data is scarce
A classic machine-learning project always follows the same path: you clean the data, you build useful variables, you choose a model, you tune its hyperparameters, you train it, you evaluate — and you start again. That work exists because the model starts from zero: it knows nothing about the world before seeing your data.
Direct consequence: the scarcer your data, the harder it is for the model to learn, and the more it risks learning your few rows "by heart" (overfitting). On 84 rows, a boosted decision tree can show 99% in training and be badly wrong on new data.
Foundation models turn the approach upside down: they have already learned how to learn, on hundreds of millions of synthetic tables, before meeting you.
2. The idea: a model that has seen millions of tables before yours
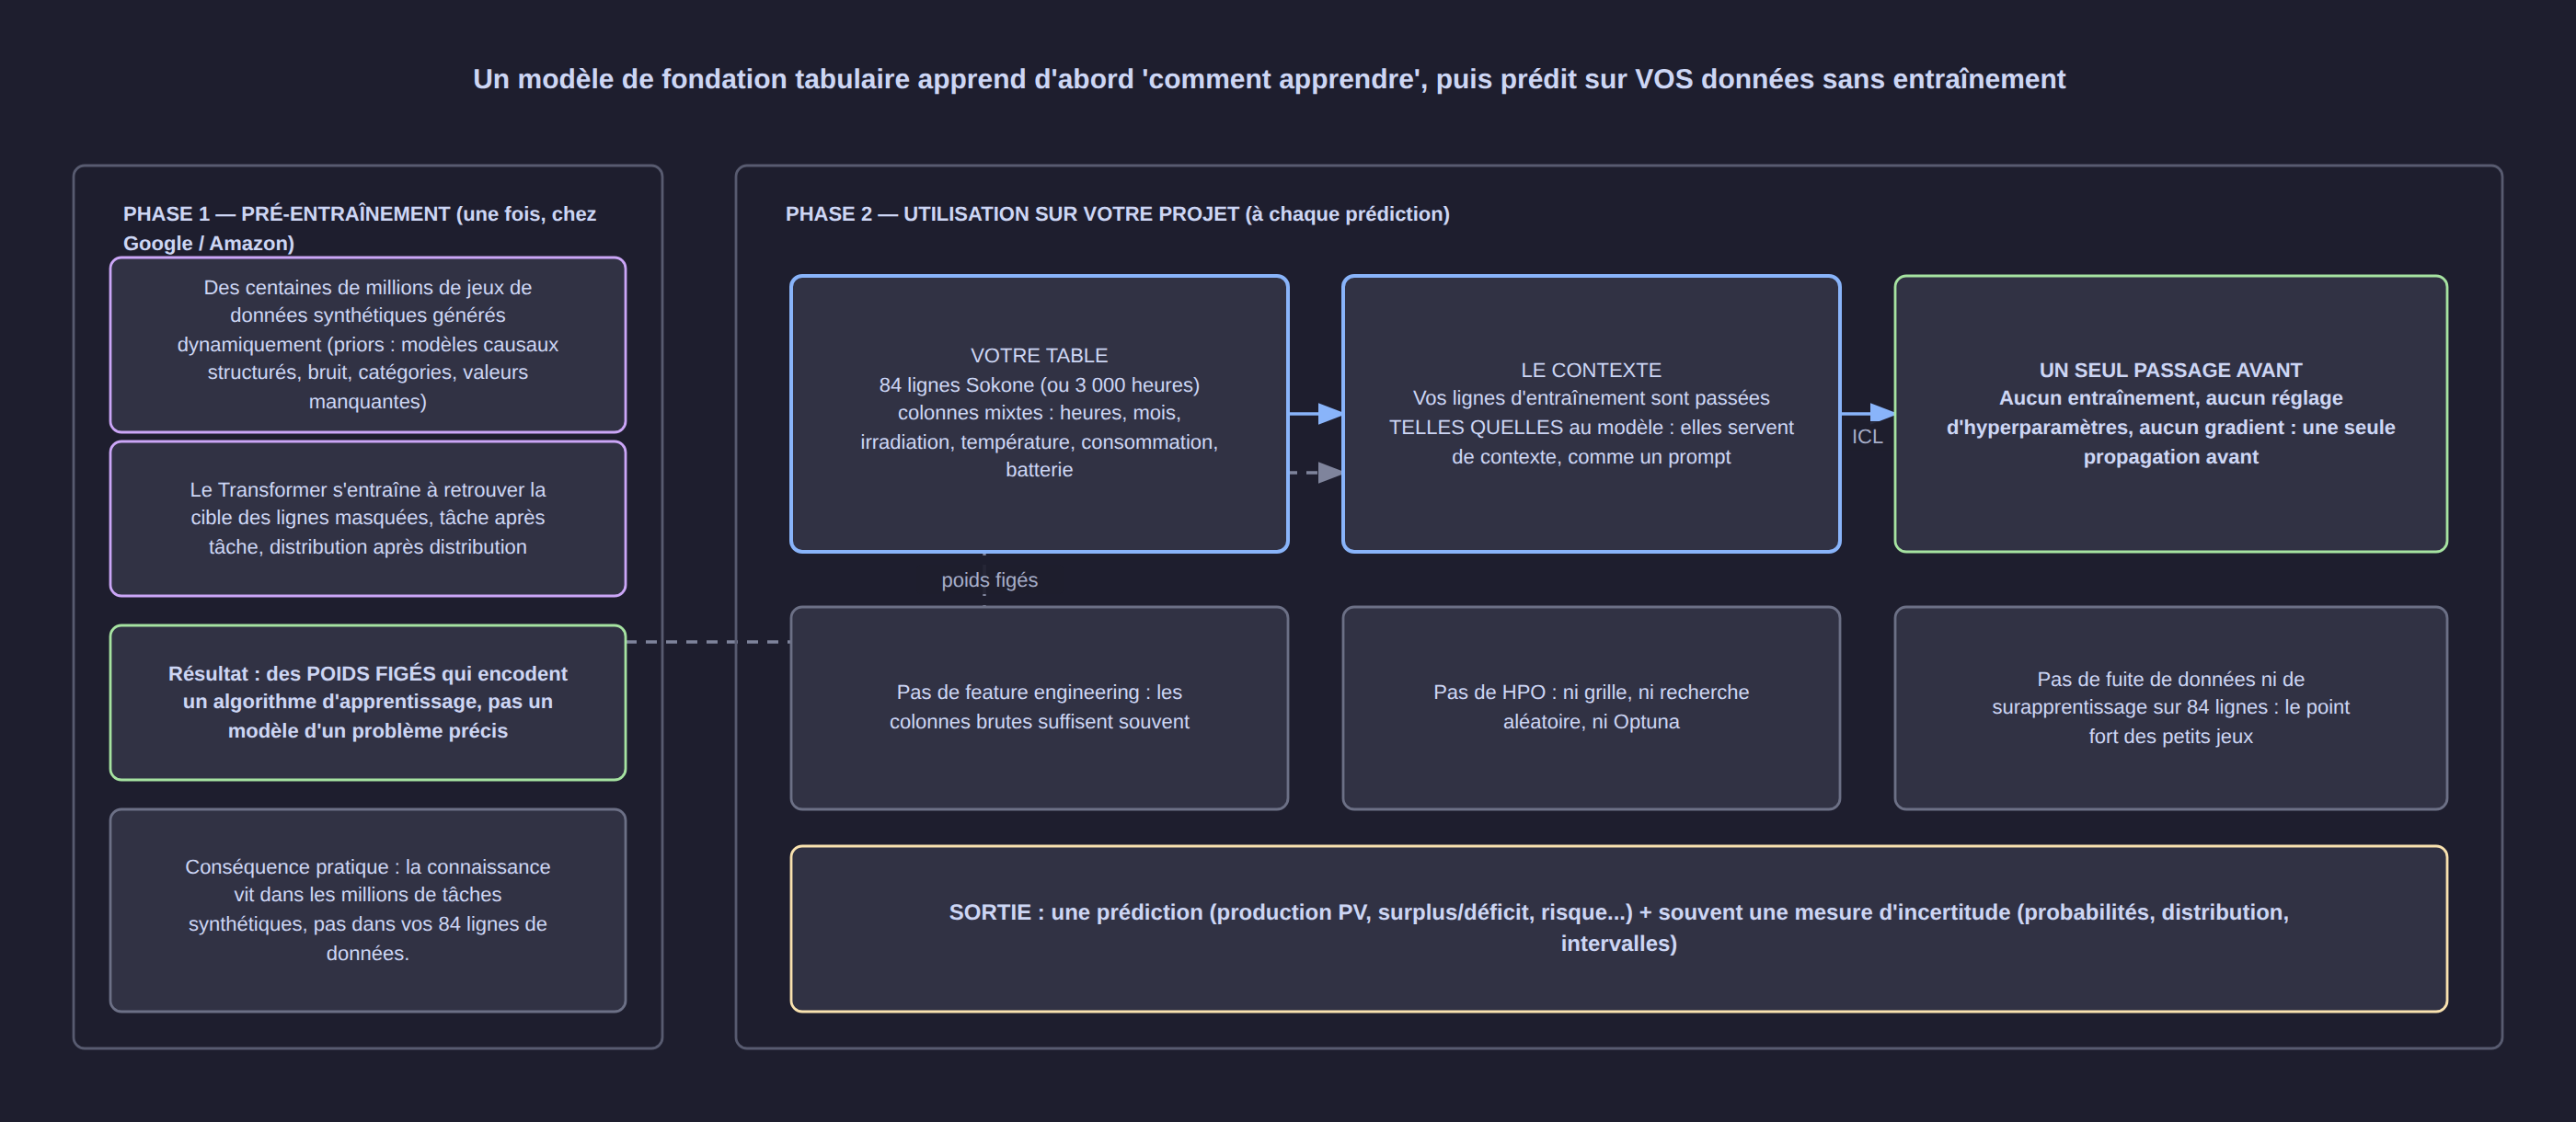
The principle comes in three steps:
- Generate synthetic tasks. Millions of small "problems" are manufactured: random tables, with plausible causal structures (one variable influences another, some values are missing, some columns are categorical).
- Train a Transformer to solve them. At each step, the model receives a table in which one column is masked and must reconstruct it. It is not trained on one problem: it is trained on the family of all problems.
- Use the model on your data, with no training. Your training rows are passed to it as context, and it predicts the test rows in a single forward pass.
This last step is what is called in-context learning (in-context learning, ICL), by analogy with a language model that is given a few examples in the prompt rather than being retrained.
3. Classic project versus foundation model: what really changes
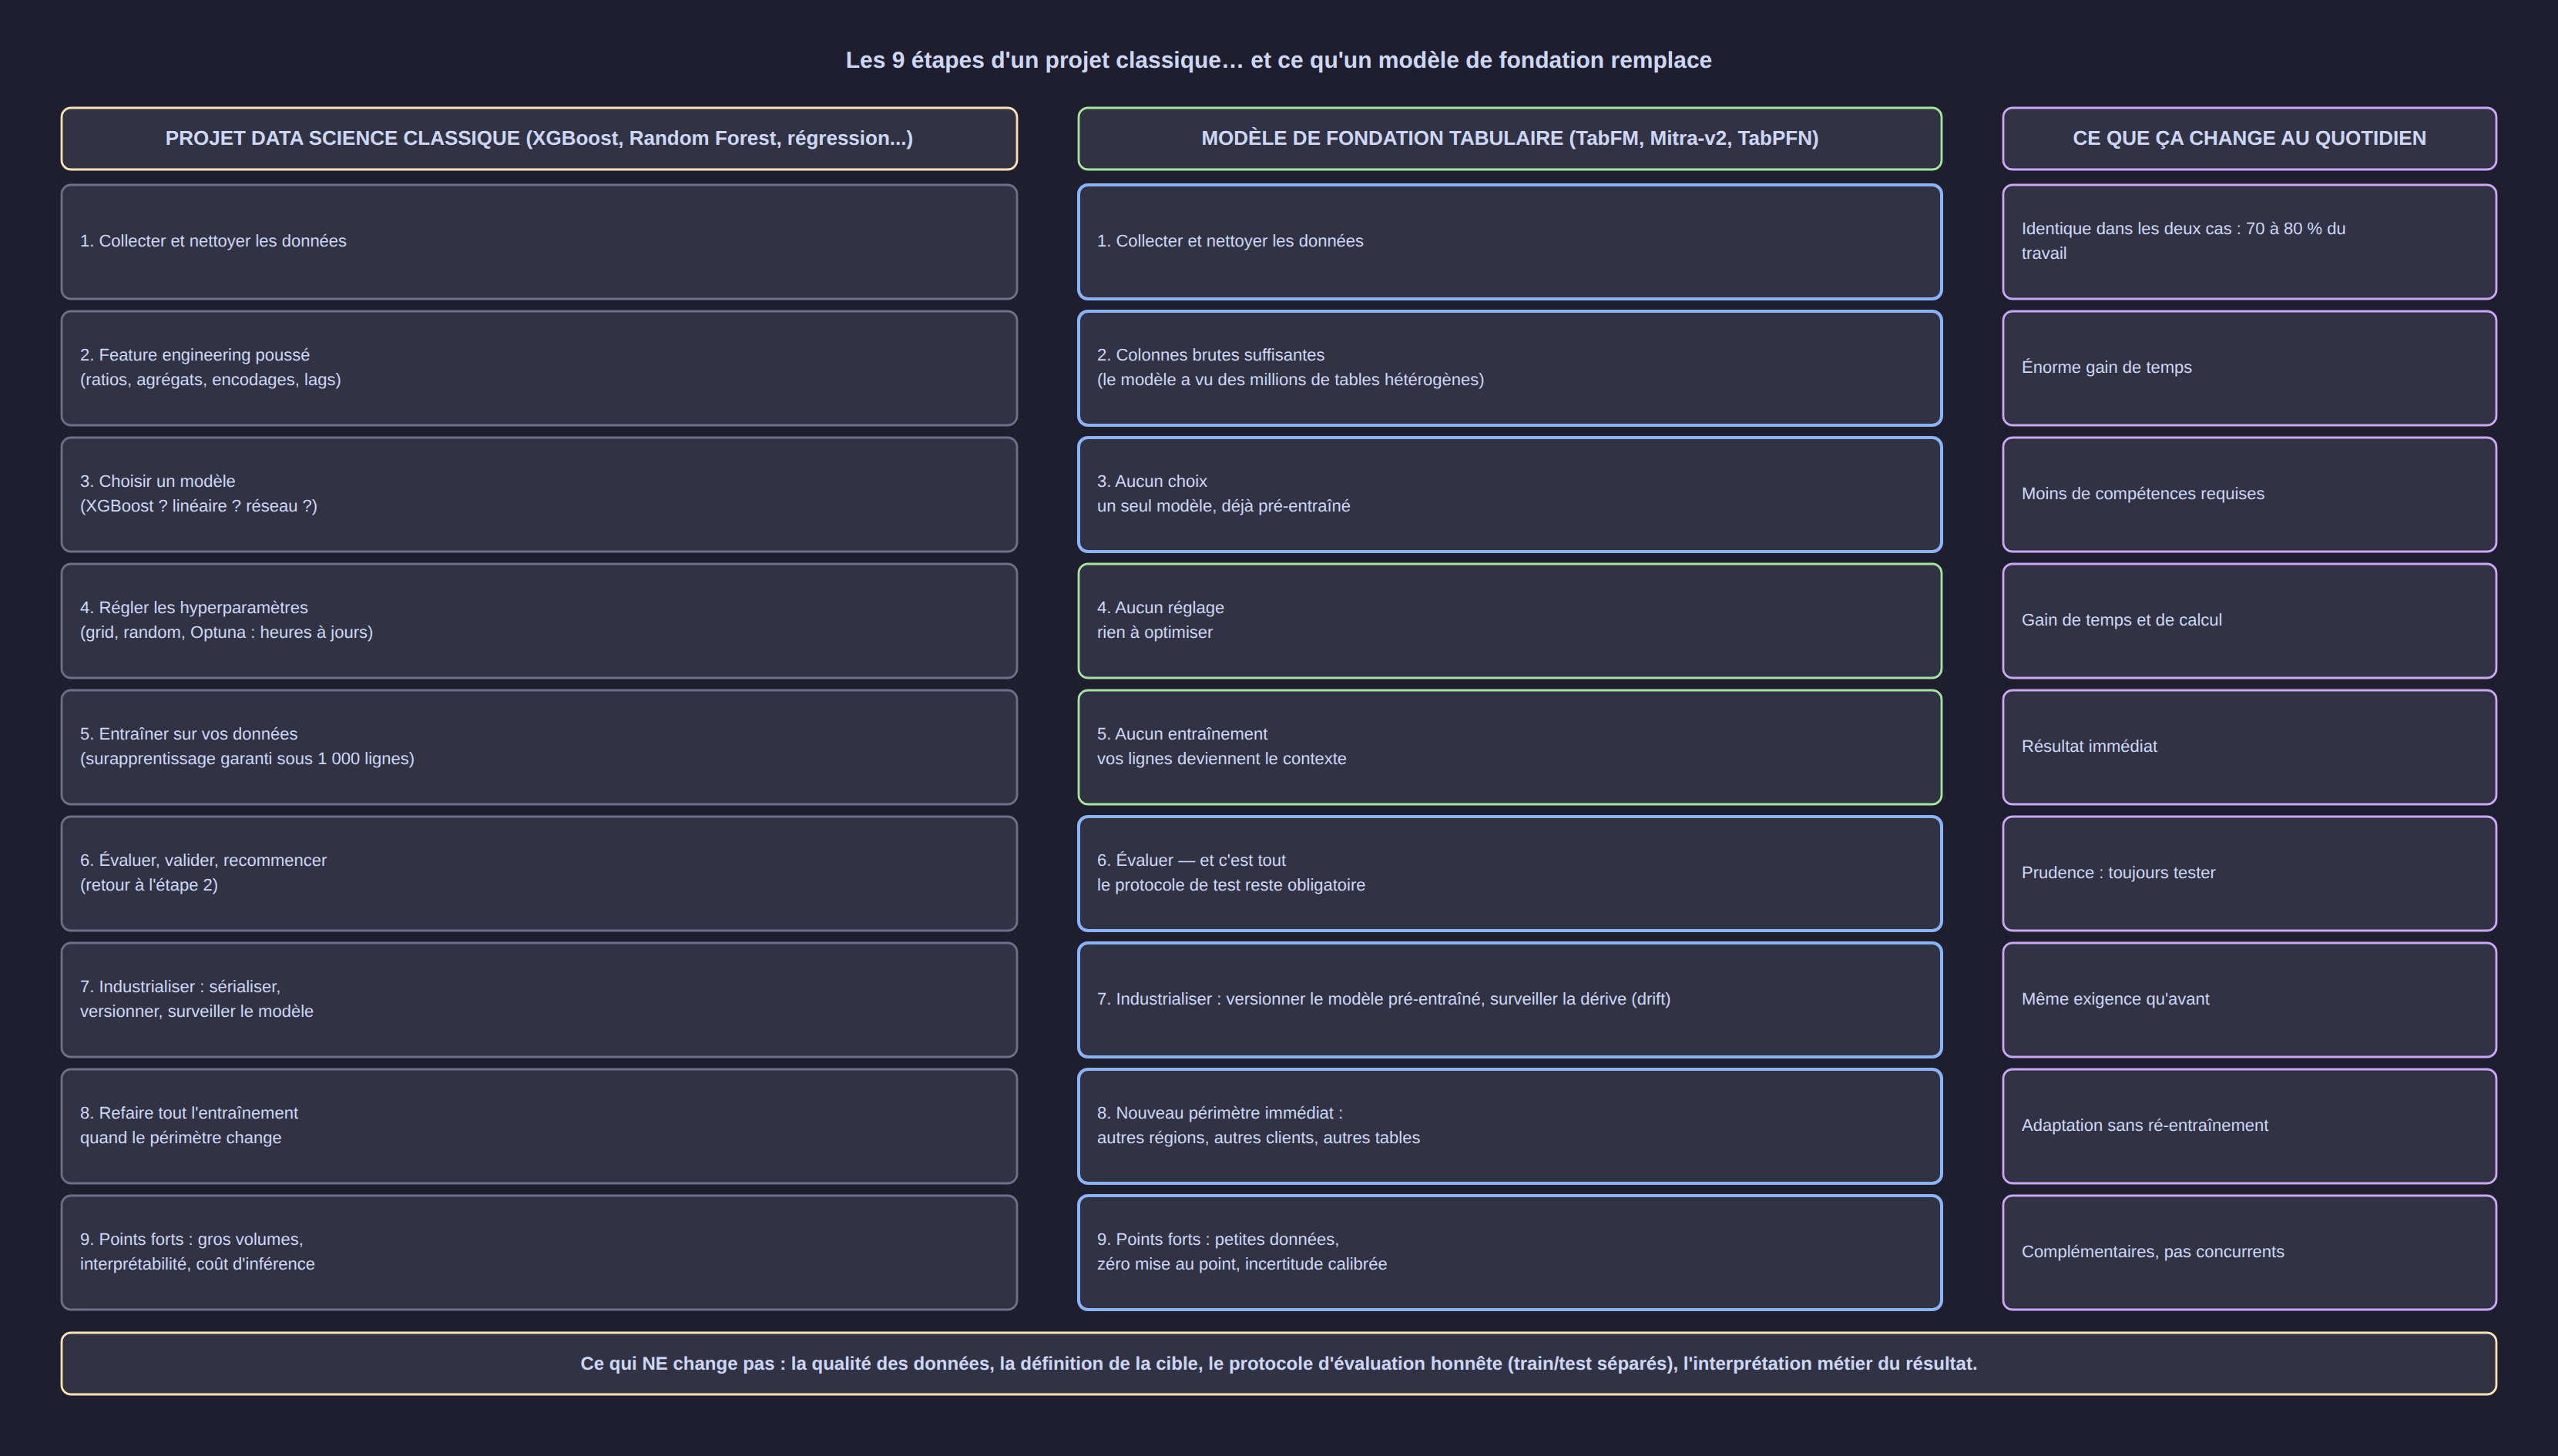
| Step of a classic project | With a foundation model |
|---|---|
| Data cleaning | Identical — 70 to 80% of the work in both cases |
| Heavy feature engineering (ratios, aggregates, encodings, lags) | The raw columns are often enough |
| Model choice (XGBoost? linear? network?) | No choice: a single pre-trained model |
| Hyperparameter tuning (grid, random search, Optuna) | No tuning |
| Training on your data | No training: your rows become the context |
| Evaluation | Evaluation — the test protocol remains mandatory |
| Industrialisation (serialisation, versioning, drift) | Same requirement: version the pre-trained model, monitor drift |
| Full rework when the scope changes | New scope immediately: other regions, other clients, other tables |
What does not change: data quality, the definition of the target, the train/test split, and the business interpretation of the result. A foundation model replaces neither the rigour nor the question asked; it replaces the tuning steps.
4. TabFM: how Google Research built it
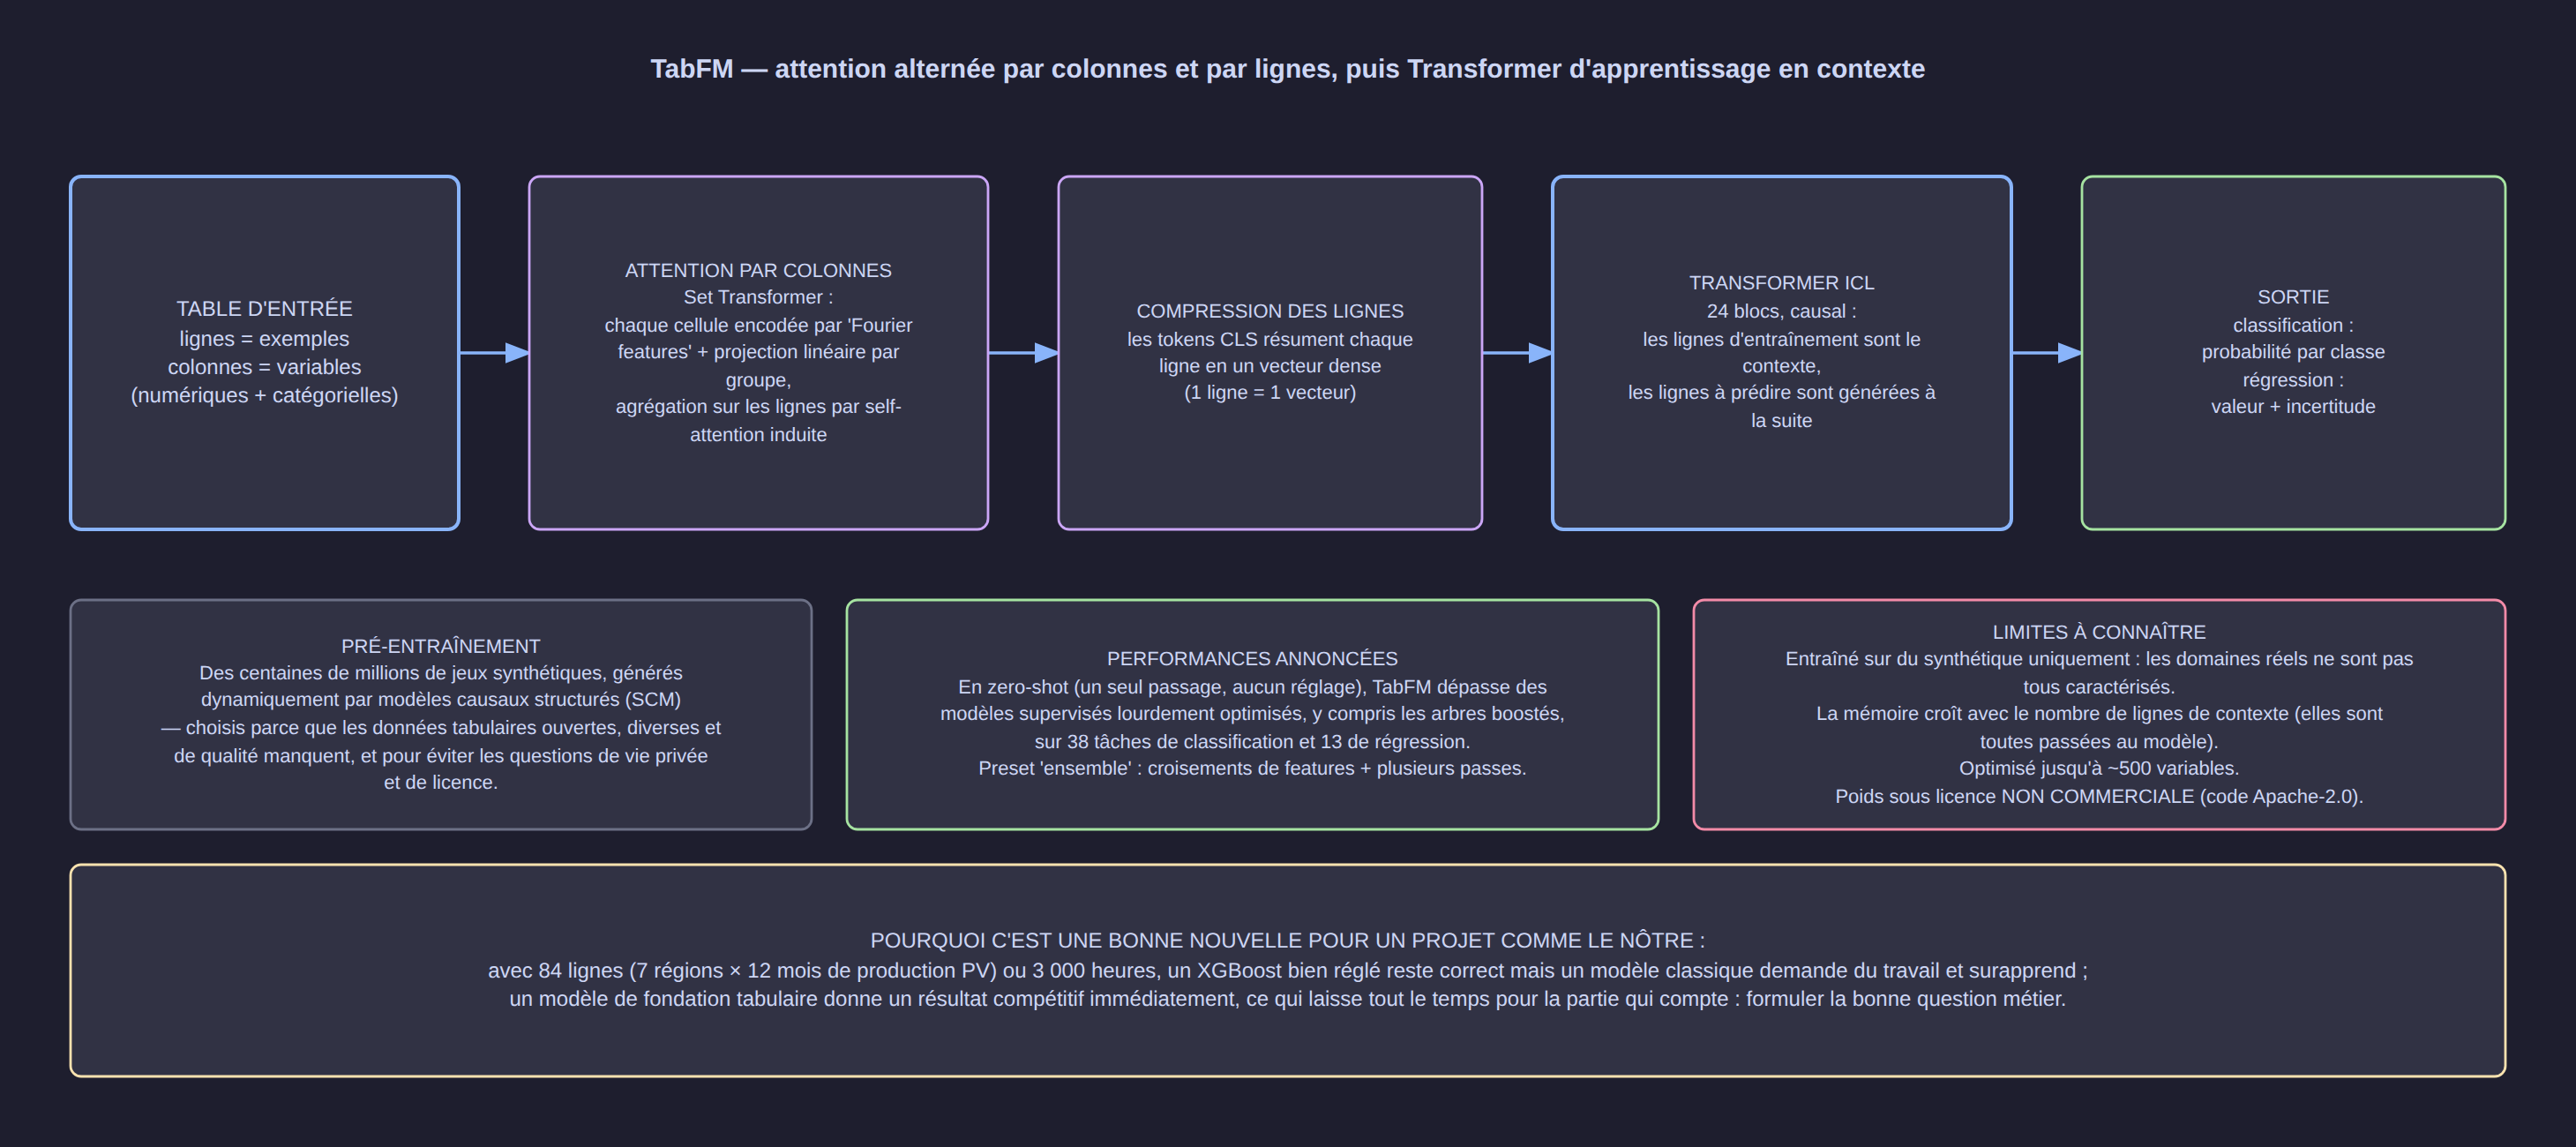
TabFM (Tabular Foundation Model, version 1.0.0, released in 2026) is a "zero-shot" tabular foundation model: it predicts the target of rows never seen before in a single pass.
Its architecture alternates two directions of attention:
- Attention by columns. Each cell is encoded (Fourier features + linear projection per column group), then the columns aggregate the information across the rows through induced self-attention — the spirit of a Set Transformer. This is where the model learns the relationships between variables.
- Row compression. CLS tokens summarise each row into a dense vector: a row becomes a point in a representation space.
- In-context learning Transformer. 24 causal blocks process these row vectors: the training rows form the context, the rows to predict come "next".
TabFM was pre-trained on hundreds of millions of synthetic datasets generated dynamically from structured causal models (structural causal models). The choice of synthetic data is accepted by the authors: open, diverse and high-quality tables are missing, and real industrial data raises privacy and licensing questions.
According to the model card, in zero-shot mode (a single pass, no tuning), TabFM beats heavily optimised supervised models — boosted trees included — on 38 classification tasks and 13 regression tasks.
[!NOTE] Licence to check before any commercial use. The TabFM code is published under the Apache-2.0 licence, but the pre-trained weights are distributed under a "non-commercial" licence (
tabfm-non-commercial-v1.0). For production use, you need either an authorisation or another model (TabPFN, Mitra-v2, or a classic model).
5. Learning in context, or changing the weights?
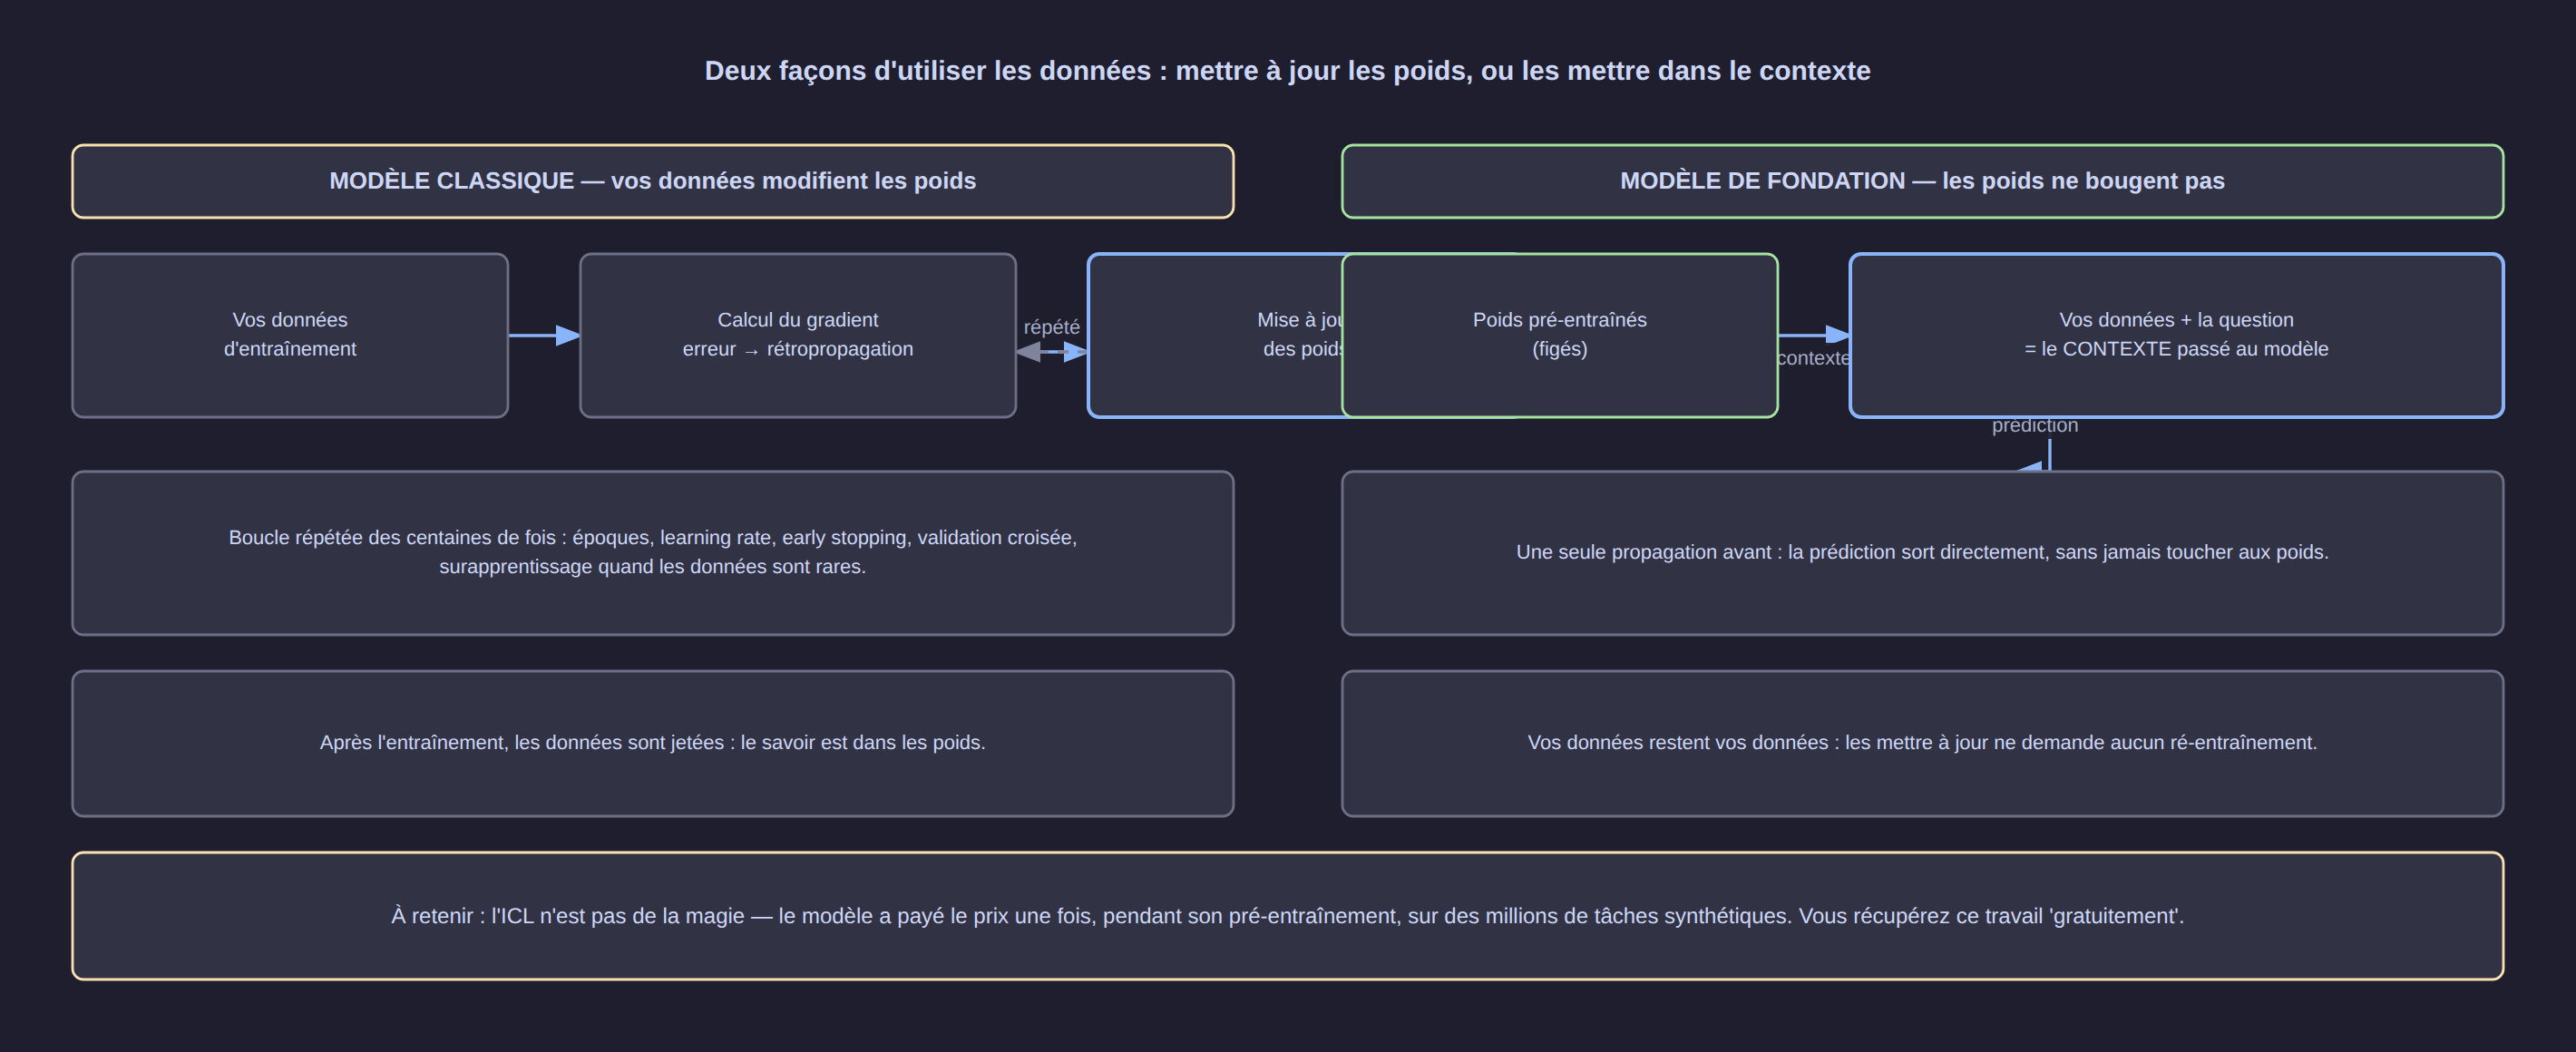
This is the most useful distinction to remember:
- Classic model: your data is used to compute a gradient, which modifies the model's weights. You repeat that for whole epochs. At the end, the data is thrown away: the knowledge lives in the weights.
- Foundation model: the weights stay frozen. Your data travels with the query, as a context. Changing dataset requires no retraining.
In practice, this means that a forecast for a new region, a new client or a new year takes a few seconds, not a night of computation.
6. The use case: a house in Badoudou (Sokone), PV production against consumption
6.1 The question asked
A house of 80 m², six people, near Sokone: what panel power and what battery capacity are needed for solar production to cover consumption, and can a foundation model help to forecast it?
6.2 The data: real first, synthetic only where necessary
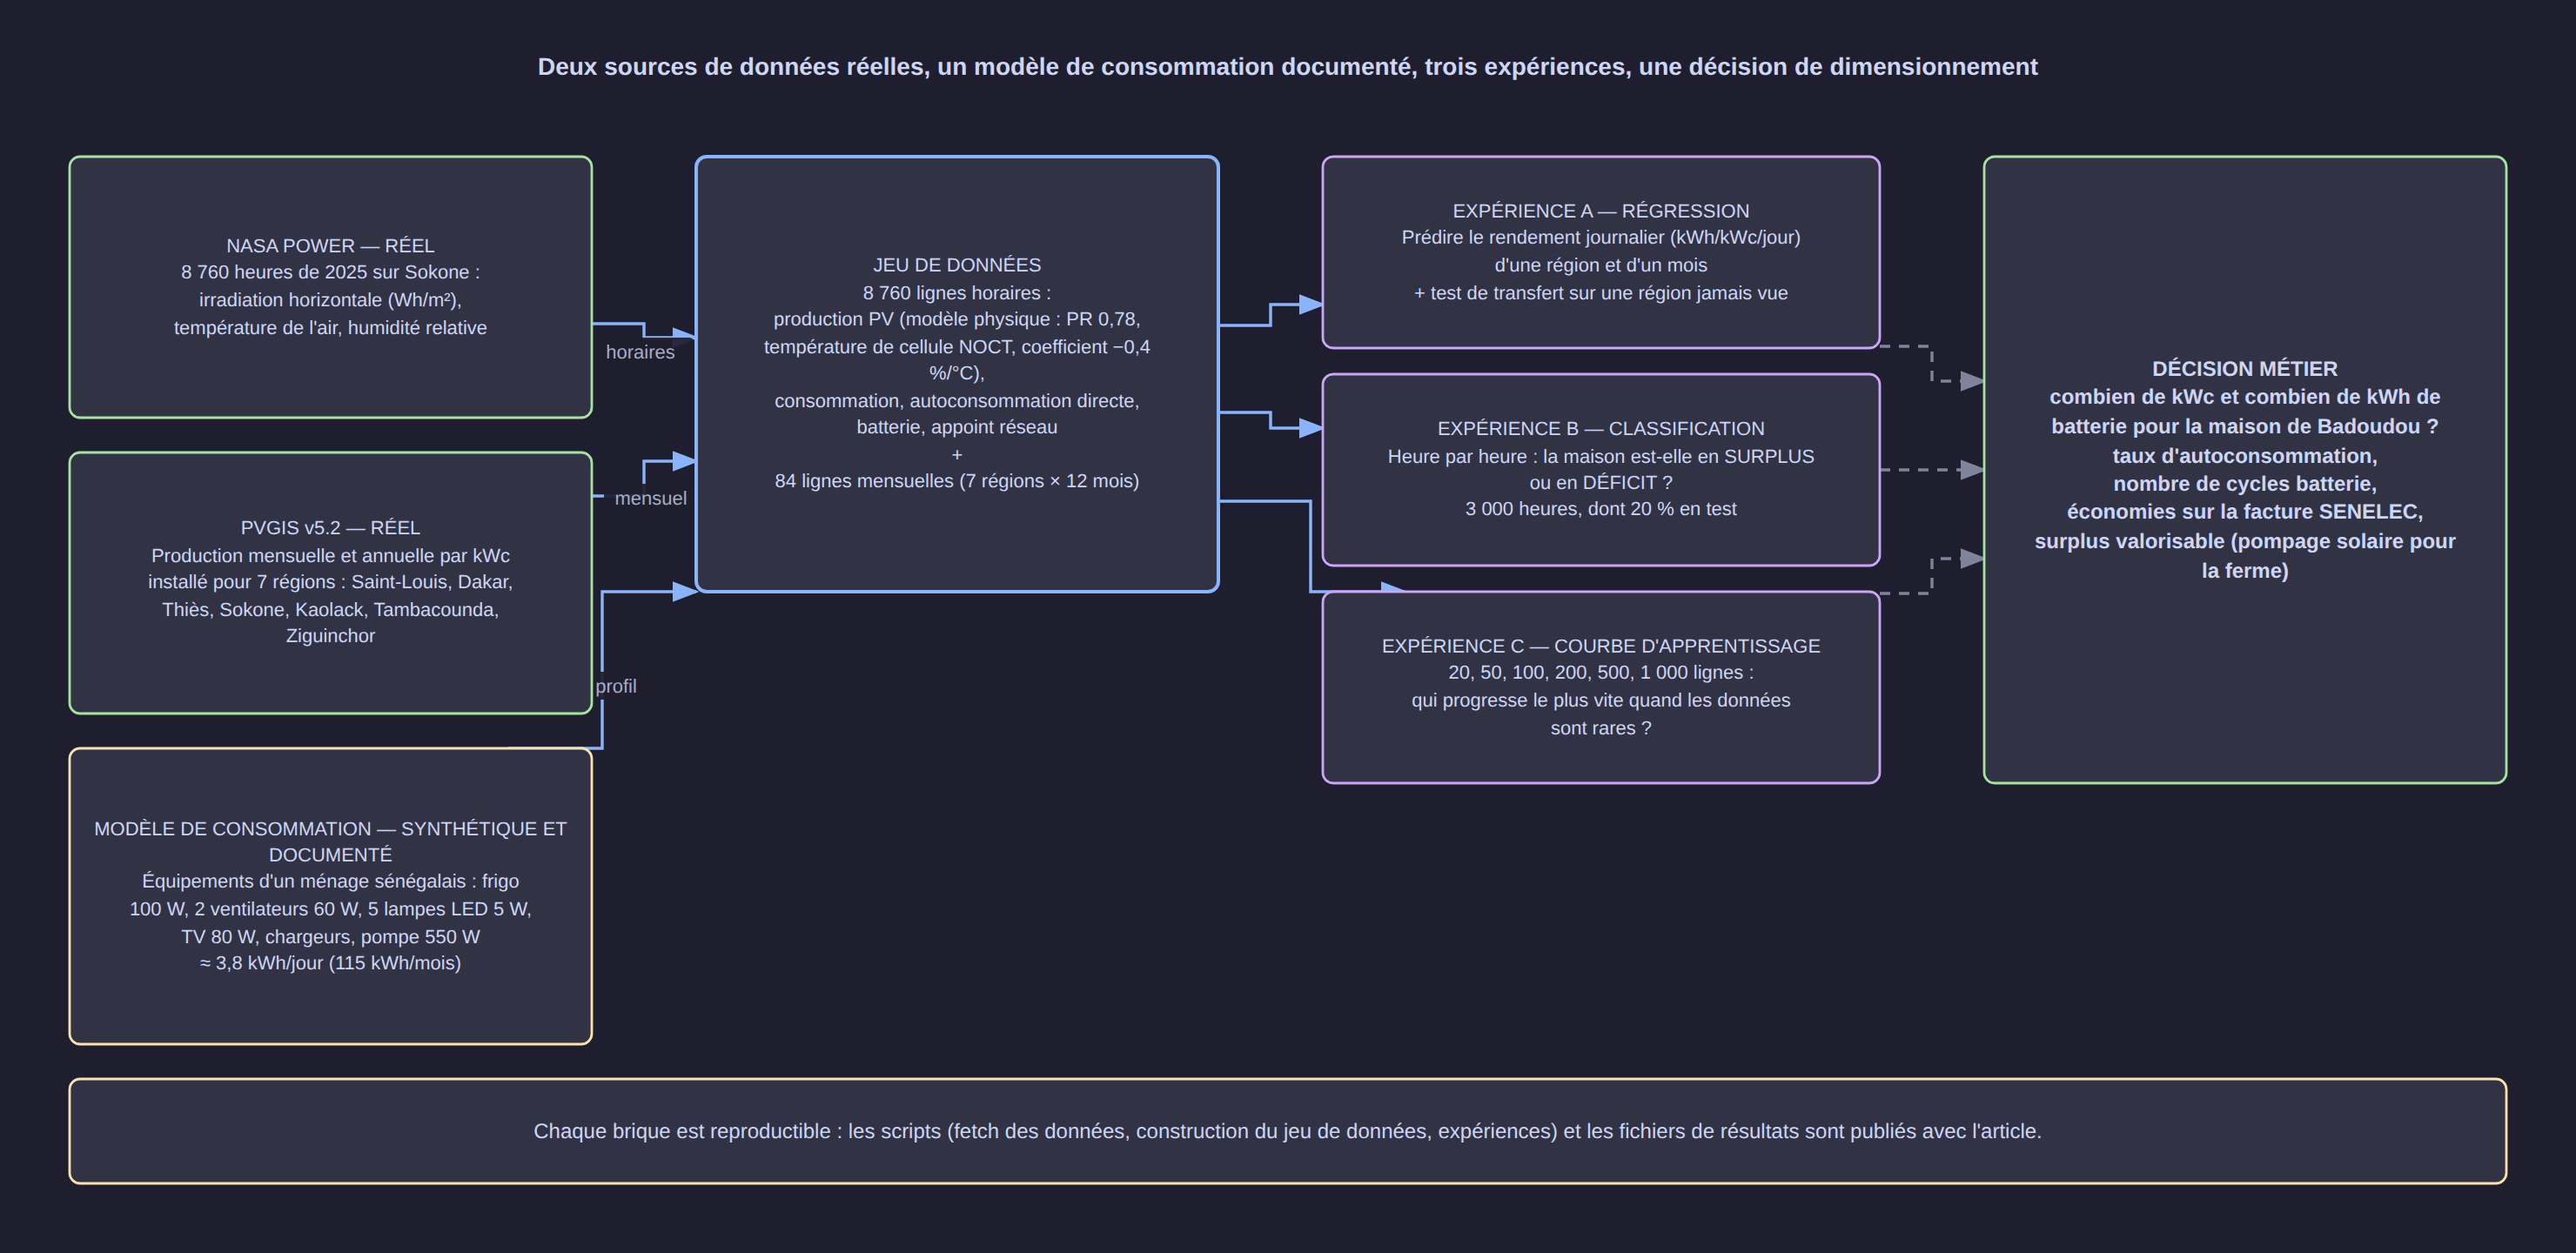
| Source | Nature | Content |
|---|---|---|
| NASA POWER (public API) | Real | 8,760 hours of the year 2025 at Sokone (13.8767° N, −16.3597° W): horizontal irradiation, air temperature, relative humidity |
| PVGIS v5.2 (European Commission) | Real | Monthly and annual photovoltaic production per kWp for 7 regions: Saint-Louis, Dakar, Thiès, Sokone, Kaolack, Tambacounda, Ziguinchor |
| Appliance model | Synthetic, documented | Consumption of a Senegalese household: 100 W refrigerator, two 60 W fans, five 5 W LED lamps, 80 W television set, phone chargers, 550 W pump |
The consumption profile is an appliance model, not a measurement: each appliance has a known power rating, a duration of use and a seasonality (fans driven by temperature, longer lighting in the rainy season, pump in the dry season). Result: ≈ 3.8 kWh per day (115 kWh per month), consistent with an equipped rural household.
Photovoltaic production is calculated with a physical model, not invented: rated power × (irradiation / 1,000) × performance ratio (0.78), with thermal de-rating (−0.4%/°C, cell temperature estimated by the NOCT model at 45 °C).
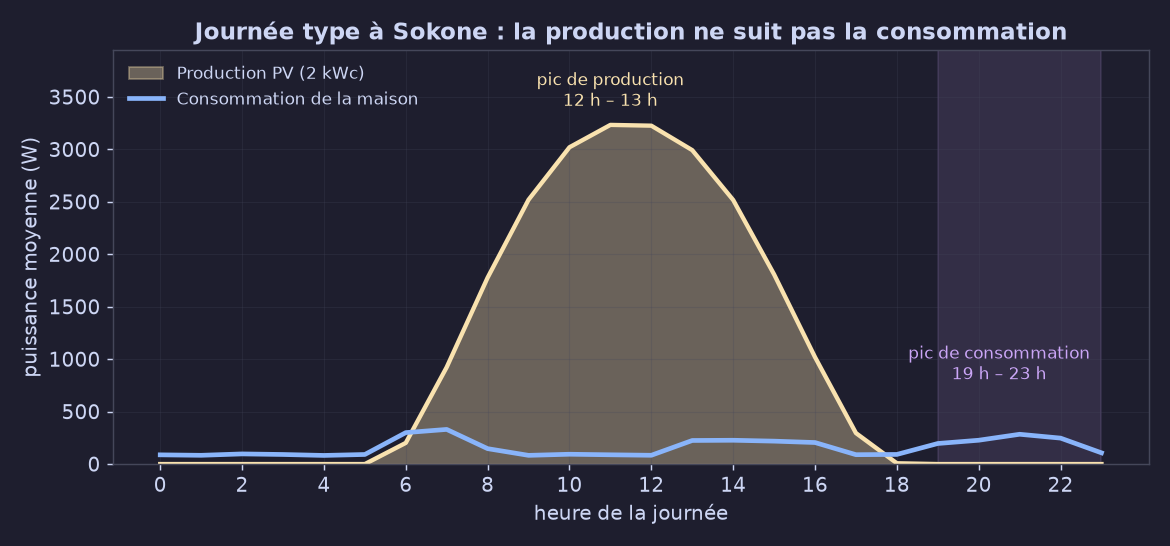
The figure above is the heart of the problem: production peaks at noon, consumption at 8 p.m. Everything that follows — battery, surplus, sizing — flows from this mismatch.
6.3 The experiment protocol — the part that makes the result credible
Three experiments, always with the same train/test split for all models:
- Experiment A — regression. Predict the daily yield (kWh/kWp/day) of a region and a month: 84 rows (7 regions × 12 months). Protocol 1: random 85/15 split. Protocol 2: leave a whole region out of training and predict it — the real test of generalisation.
- Experiment B — classification. Hour by hour, is the house in surplus (production
consumption) or in deficit? 1,500 hours sampled out of 8,760, 33% in the test set.
- Experiment C — learning curve. 20, 50, 100, 200, 500 then 1,000 training rows: which one progresses fastest when data is scarce?
Models compared: mean/majority class (naive baseline), linear regression, Random Forest, HistGradientBoosting (boosted trees), and TabPFN v2 in zero-shot mode — the reference tabular foundation model that runs locally, from the same family of ideas as TabFM (in-context learning, no training on the user's data).
[!NOTE] Why TabPFN and not TabFM in the experiment? TabPFN v2 runs locally on CPU with public weights, which makes the experiment reproducible by anyone. TabFM's weights are under a non-commercial licence, and recent versions of TabPFN require licence acceptance and an API key. Version used: tabpfn 2.1.3. The conclusions concern the family of models (in-context learning), not a vendor.
6.4 Results
a) Random split (85% training / 15% test)
First level of difficulty: the rows are shuffled, each model sees a little of every region and must predict the 13 remaining rows.
| Model | MAE (kWh/kWp/day) | RMSE | R² | Training time |
|---|---|---|---|---|
| Naive mean (baseline) | 0.150 | 0.243 | −0.01 | — |
| Linear regression | 0.126 | 0.159 | 0.56 | 0.01 s |
| HistGradientBoosting | 0.124 | 0.151 | 0.61 | 0.06 s |
| Random Forest | 0.067 | 0.093 | 0.85 | 0.23 s |
| TabPFN v2 zero-shot | 0.025 | 0.030 | 0.98 | 0.43 s |
With 71 training rows, the zero-shot foundation model obtains R² = 0.98 and an error of 0.025 kWh/kWp/day, i.e. 0.5% of the average daily production — with no tuning, in 0.4 second, whereas the boosted tree peaks at R² = 0.61. Note also the "naive mean" row: its R² is negative, which means it does worse than predicting the mean — that is the baseline every model must beat.
b) Predicting a region never seen before — 84 rows in total
The hardest test: one whole region is removed from training (12 rows) and the model is asked to predict its production. No model has ever seen that region.
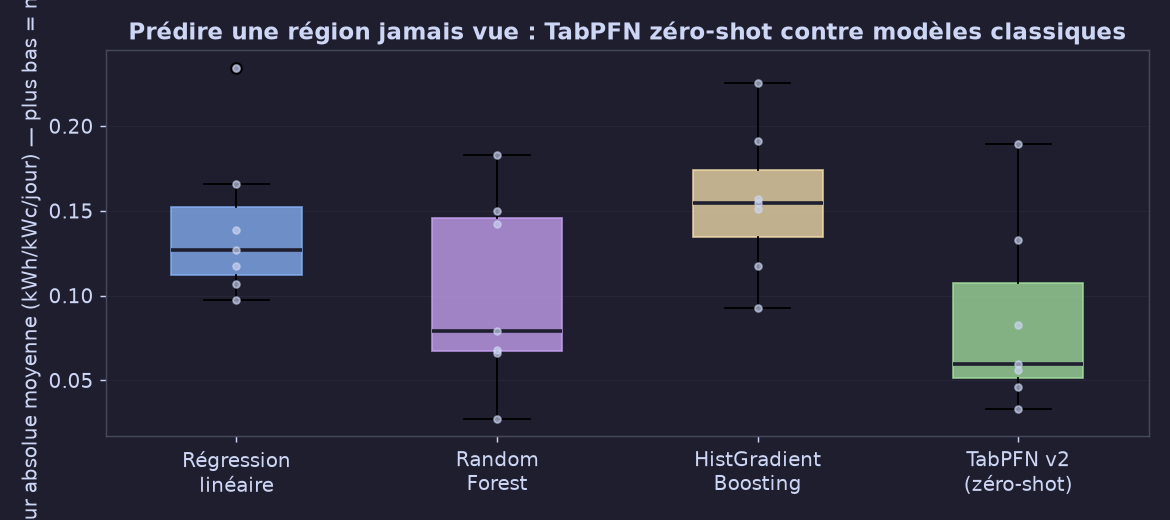
| Held-out region | Linear regression (MAE) | Random Forest (MAE) | HistGradientBoosting (MAE) | TabPFN v2 zero-shot (MAE) |
|---|---|---|---|---|
| Dakar | 0.166 | 0.183 | 0.192 | 0.133 |
| Kaolack | 0.127 | 0.068 | 0.093 | 0.046 |
| Saint-Louis | 0.118 | 0.150 | 0.154 | 0.190 |
| Sokone | 0.098 | 0.027 | 0.151 | 0.033 |
| Tambacounda | 0.234 | 0.079 | 0.118 | 0.059 |
| Thiès | 0.139 | 0.066 | 0.157 | 0.083 |
| Ziguinchor | 0.107 | 0.142 | 0.226 | 0.056 |
| Mean | 0.141 | 0.102 | 0.156 | 0.086 |
The unit is the kWh per kWp and per day. The average consumption of the dataset being 4.7 kWh/kWp/day, an error of 0.086 corresponds to about 1.8% relative error.
Put plainly:
- Zero-shot TabPFN obtains the best average error (0.086) with no tuning at all, ahead of a hand-tuned Random Forest (0.102) and a boosted tree (0.156). Its average R² is 0.93.
- Essential nuance: it loses on Saint-Louis (0.190 against 0.150 for the Random Forest) — the most productive region, the one it must extrapolate furthest from what it has seen. A foundation model is not magic: it is excellent at interpolation, more fragile at the extremes.
- Linear regression is not ridiculous (0.141). It is the reminder that a simple baseline must always appear in the comparison: without it, you do not know whether the sophisticated model brings anything at all.
c) Predicting hour by hour: surplus or deficit?
The operational question — "at this hour, does the house produce more than it consumes?" — over 1,500 hours sampled across the year, one third kept for the test set (500 hours).
| Model | Accuracy | F1 ("surplus" class) | AUC | Training time | Prediction time |
|---|---|---|---|---|---|
| Majority class (naive baseline) | 55.6% | 0.000 | — | — | — |
| Logistic regression | 99.39% | 0.993 | 0.9998 | 0.01 s | < 0.01 s |
| Random Forest | 99.60% | 0.996 | 0.9999 | 0.36 s | 0.02 s |
| HistGradientBoosting | 99.80% | 0.998 | 1.0000 | 0.11 s | 0.01 s |
| TabPFN v2 zero-shot | 100.00% | 1.000 | 1.0000 | 0.16 s | 472 s |
What this table teaches — and it matters more than the ranking: when the target is almost deterministic (surplus is defined by production > consumption, and both are nearly known in the input variables), every serious model is excellent. The foundation model reaches 100% — but it takes 472 seconds to predict 500 rows on a CPU, against 0.01 second for a logistic regression that reaches 99.4%.
[!IMPORTANT] The right question is not "which model wins?" but "which model wins enough, at what cost?" A foundation model is precious when your data is scarce and the problem is hard; it is superfluous when a straight line already separates the classes. Here, the difference between 99.4% and 100% is probably not worth an inference time multiplied by 40,000.
d) How many rows do you really need?
This is the most instructive of the three experiments: the same models are trained with 20, 50, 100, 200, 500 then 1,000 rows, and accuracy is measured on the same test set.
| Training rows | Random Forest | HistGradientBoosting | TabPFN v2 zero-shot |
|---|---|---|---|
| 20 | 95.96% | 55.56% | 97.17% |
| 50 | 95.56% | 94.34% | 98.79% |
| 100 | 96.36% | 99.39% | 99.80% |
| 200 | 98.79% | 99.39% | 99.80% |
| 500 | 98.99% | 99.60% | 100.00% |
| 1,000 | 99.60% | 99.80% | 100.00% |
Reading: from 20 rows, the zero-shot foundation model is already at 97.2% — whereas the boosted tree is at 55.6% (it cannot learn with so little data) and the Random Forest needs 200 rows to reach a comparable level. This is exactly the operating regime of small projects: one field, one house, one client, one sensor. The foundation model is not only "as good": it is usable much earlier.
6.5 What the model really has to predict: sizing
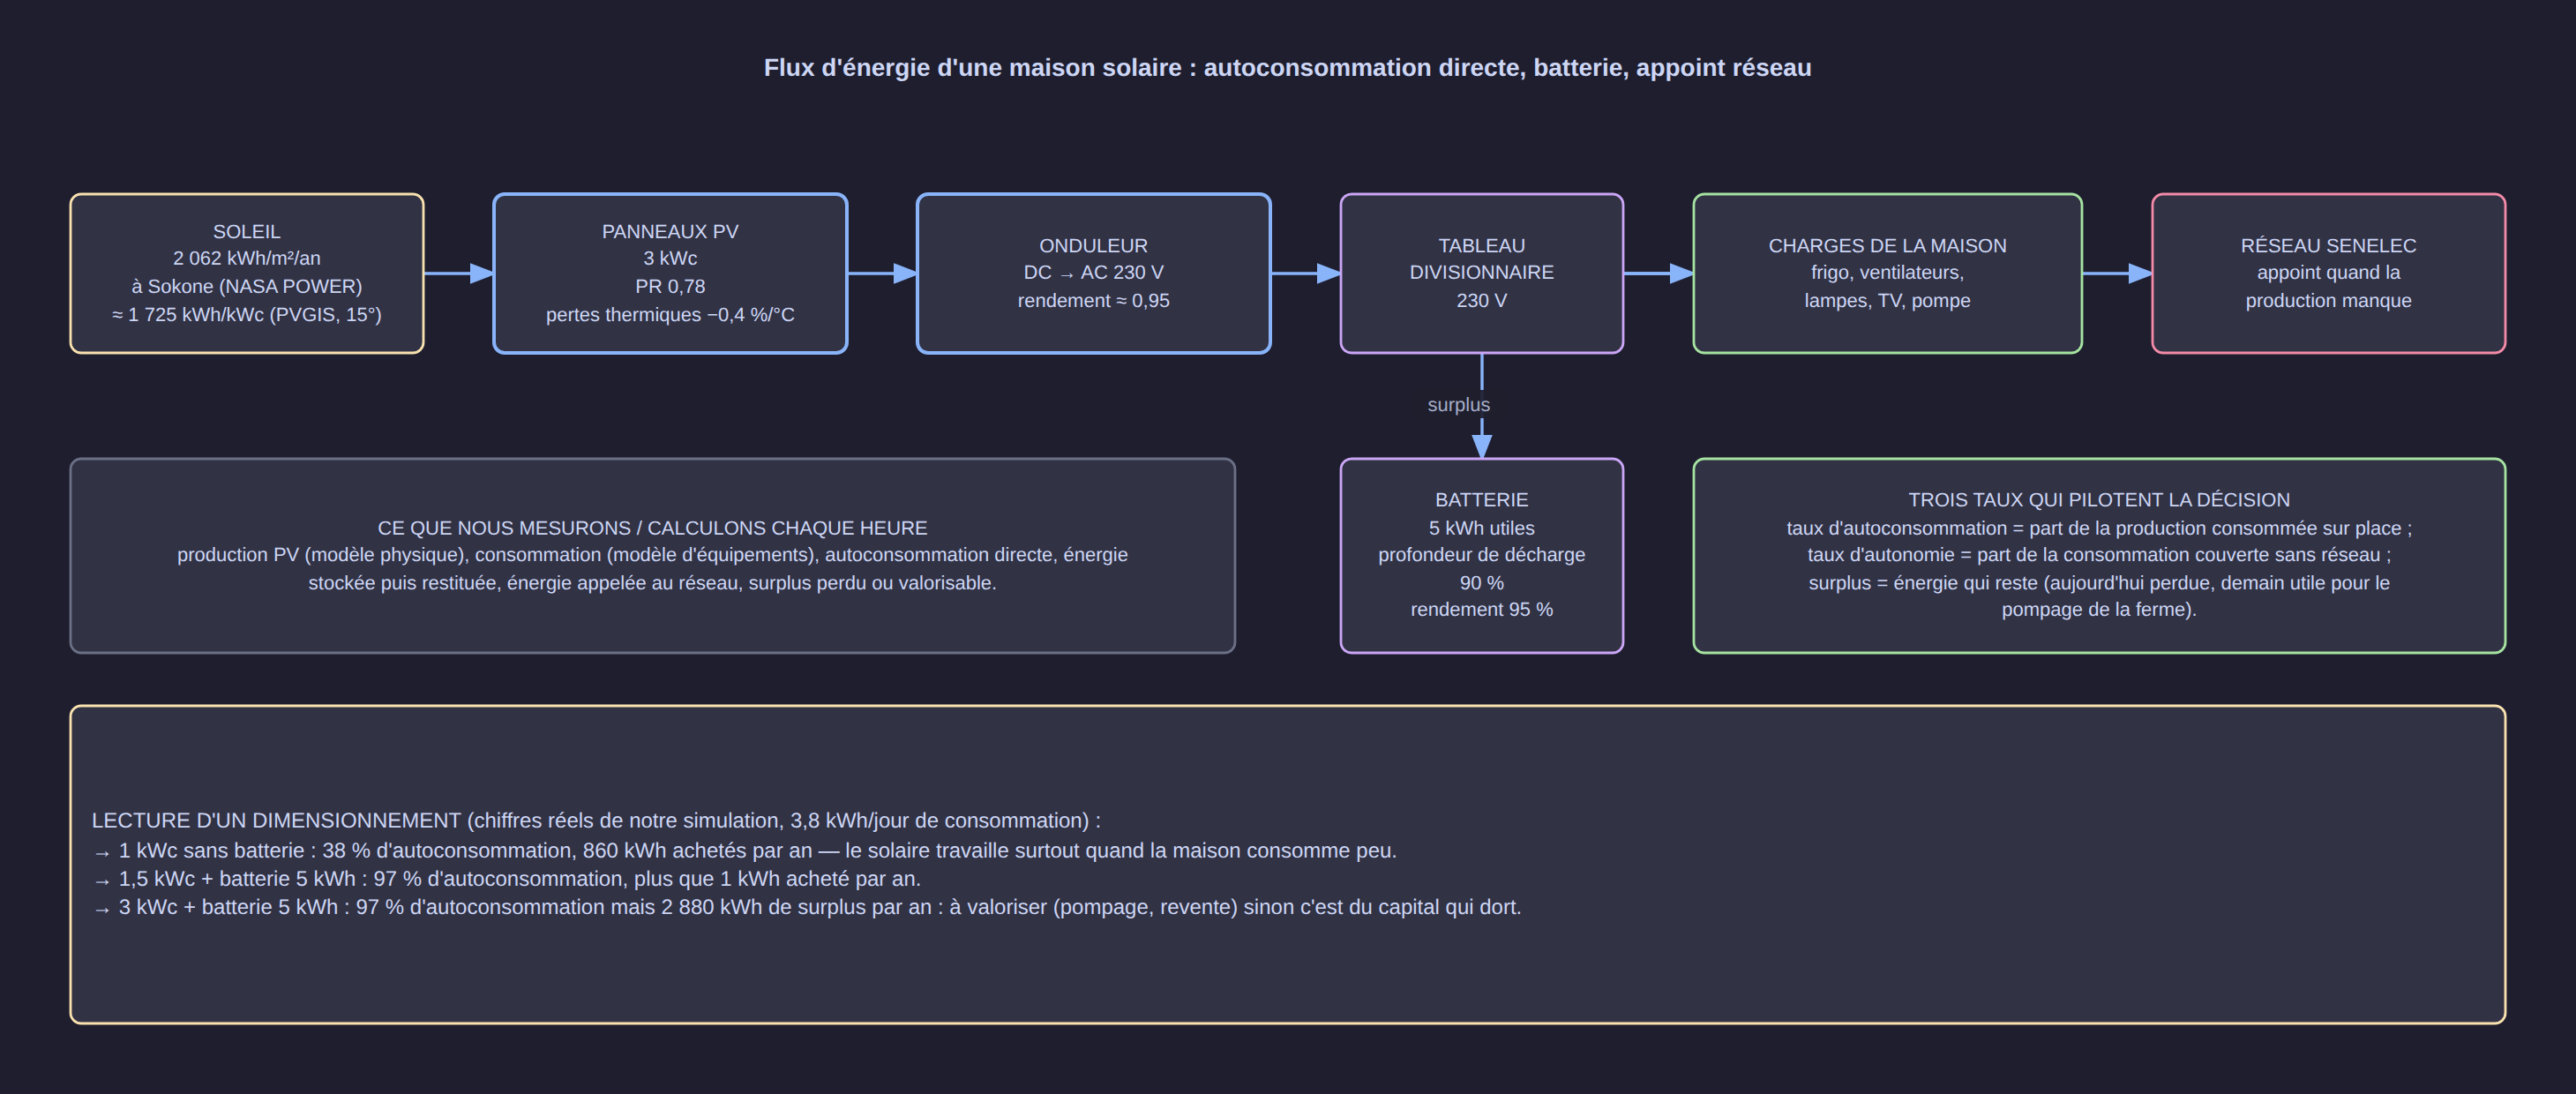
Once production and consumption are modelled hour by hour, the sizing question becomes a simple energy balance.
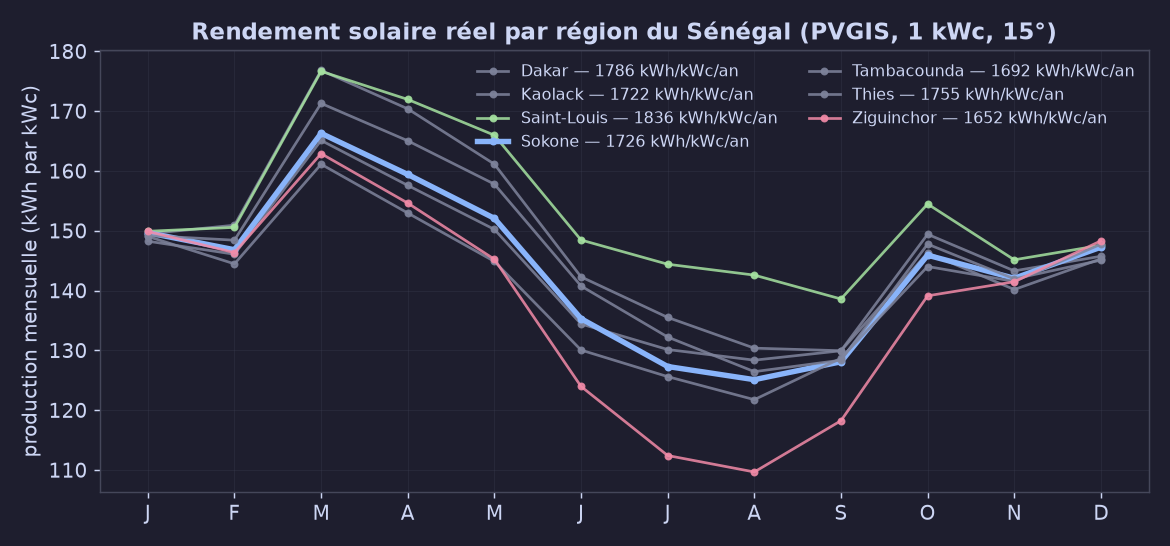
The regional gap is real: Saint-Louis produces 1,836 kWh per kWp and per year, Ziguinchor 1,652, i.e. an 11% gap between the best and the worst site — enough to change a sizing calculation.
Full simulation over 8,760 hours, with a 5 kWh battery (depth of discharge 90%, efficiency 95%):
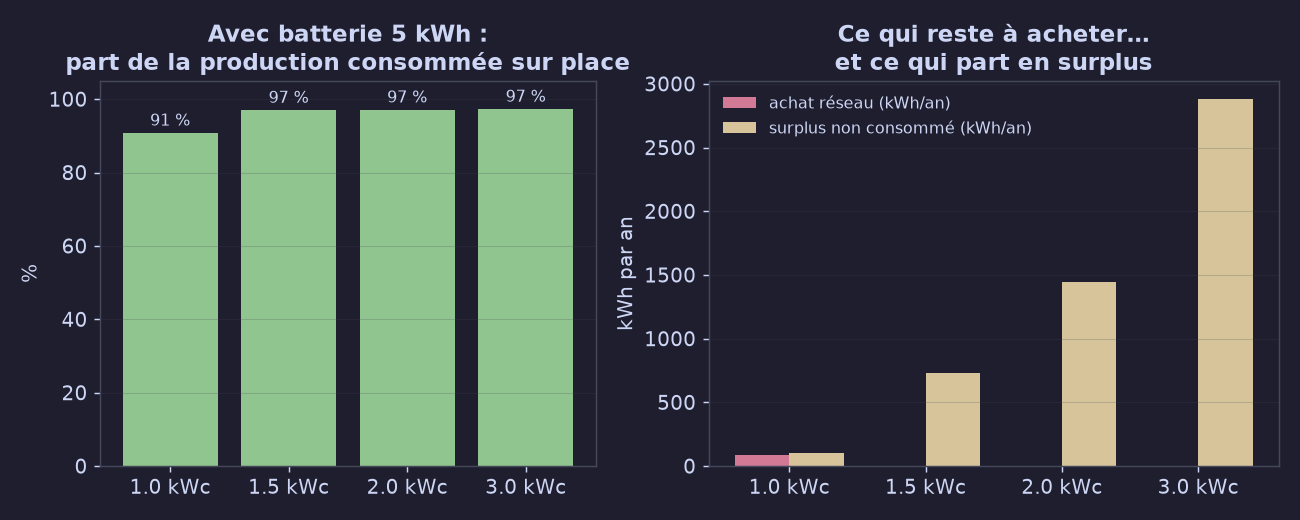
| Installed power | No battery: self-consumption | No battery: grid purchase | With 5 kWh battery: self-consumption | With battery: grid purchase | Annual surplus |
|---|---|---|---|---|---|
| 1.0 kWp | 37.6% | 860 kWh | 90.8% | 88 kWh | 101 kWh |
| 1.5 kWp | 41.3% | 809 kWh | 97.0% | 1 kWh | 728 kWh |
| 2.0 kWp | 43.5% | 779 kWh | 97.1% | 1 kWh | 1,446 kWh |
| 3.0 kWp | 46.4% | 739 kWh | 97.3% | 0.5 kWh | 2,880 kWh |
Three lessons, valid well beyond Senegal:
- Without storage, solar works when the house is not consuming. The production peak is at noon, the consumption peak at 8 p.m.
- The battery changes everything: self-consumption goes from ~40% to 90–97%.
- Oversizing brings nothing to the house: from 1.5 kWp onwards, grid purchase is already almost nil; the extra kilowatts go into surplus. That surplus has a value — solar pumping for irrigation, outdoor lighting, a workshop — but only if it is used.
6.6 How much does it save, in CFA francs
SENELEC tariffs applicable on 1 January 2026 (approved grid, Domestique Petite Puissance — Domestic Small Power — category):
| Monthly bracket | Energy price |
|---|---|
| 0 to 150 kWh | 82.00 FCFA/kWh |
| 151 to 250 kWh | 136.49 FCFA/kWh |
| More than 250 kWh | 159.36 FCFA/kWh |
(the 1st bracket fell by 10% on 1 January 2026; a fixed monthly charge depending on the subscribed power and a rural electrification levy of 0.7 FCFA/kWh already included are added to it)
With a consumption of 1,378 kWh/year, the whole consumption stays in the first bracket:
- annual consumption to cover: 1,378 kWh × 82 FCFA ≈ 113,000 FCFA per year;
- with 1.5 kWp + a 5 kWh battery, grid purchase falls to ~1 kWh/year: the annual saving is therefore of the order of 113,000 FCFA (excluding the fixed charge).
In other words: solar mainly replaces a modest but real bill, and its profitability depends on the price of the installed kit, not on the kWh saved. This is a calculation to be redone with a real quotation — the surplus that is not valued is, for its part, an investment that sleeps.
7. When to use a foundation model (and when to avoid it)
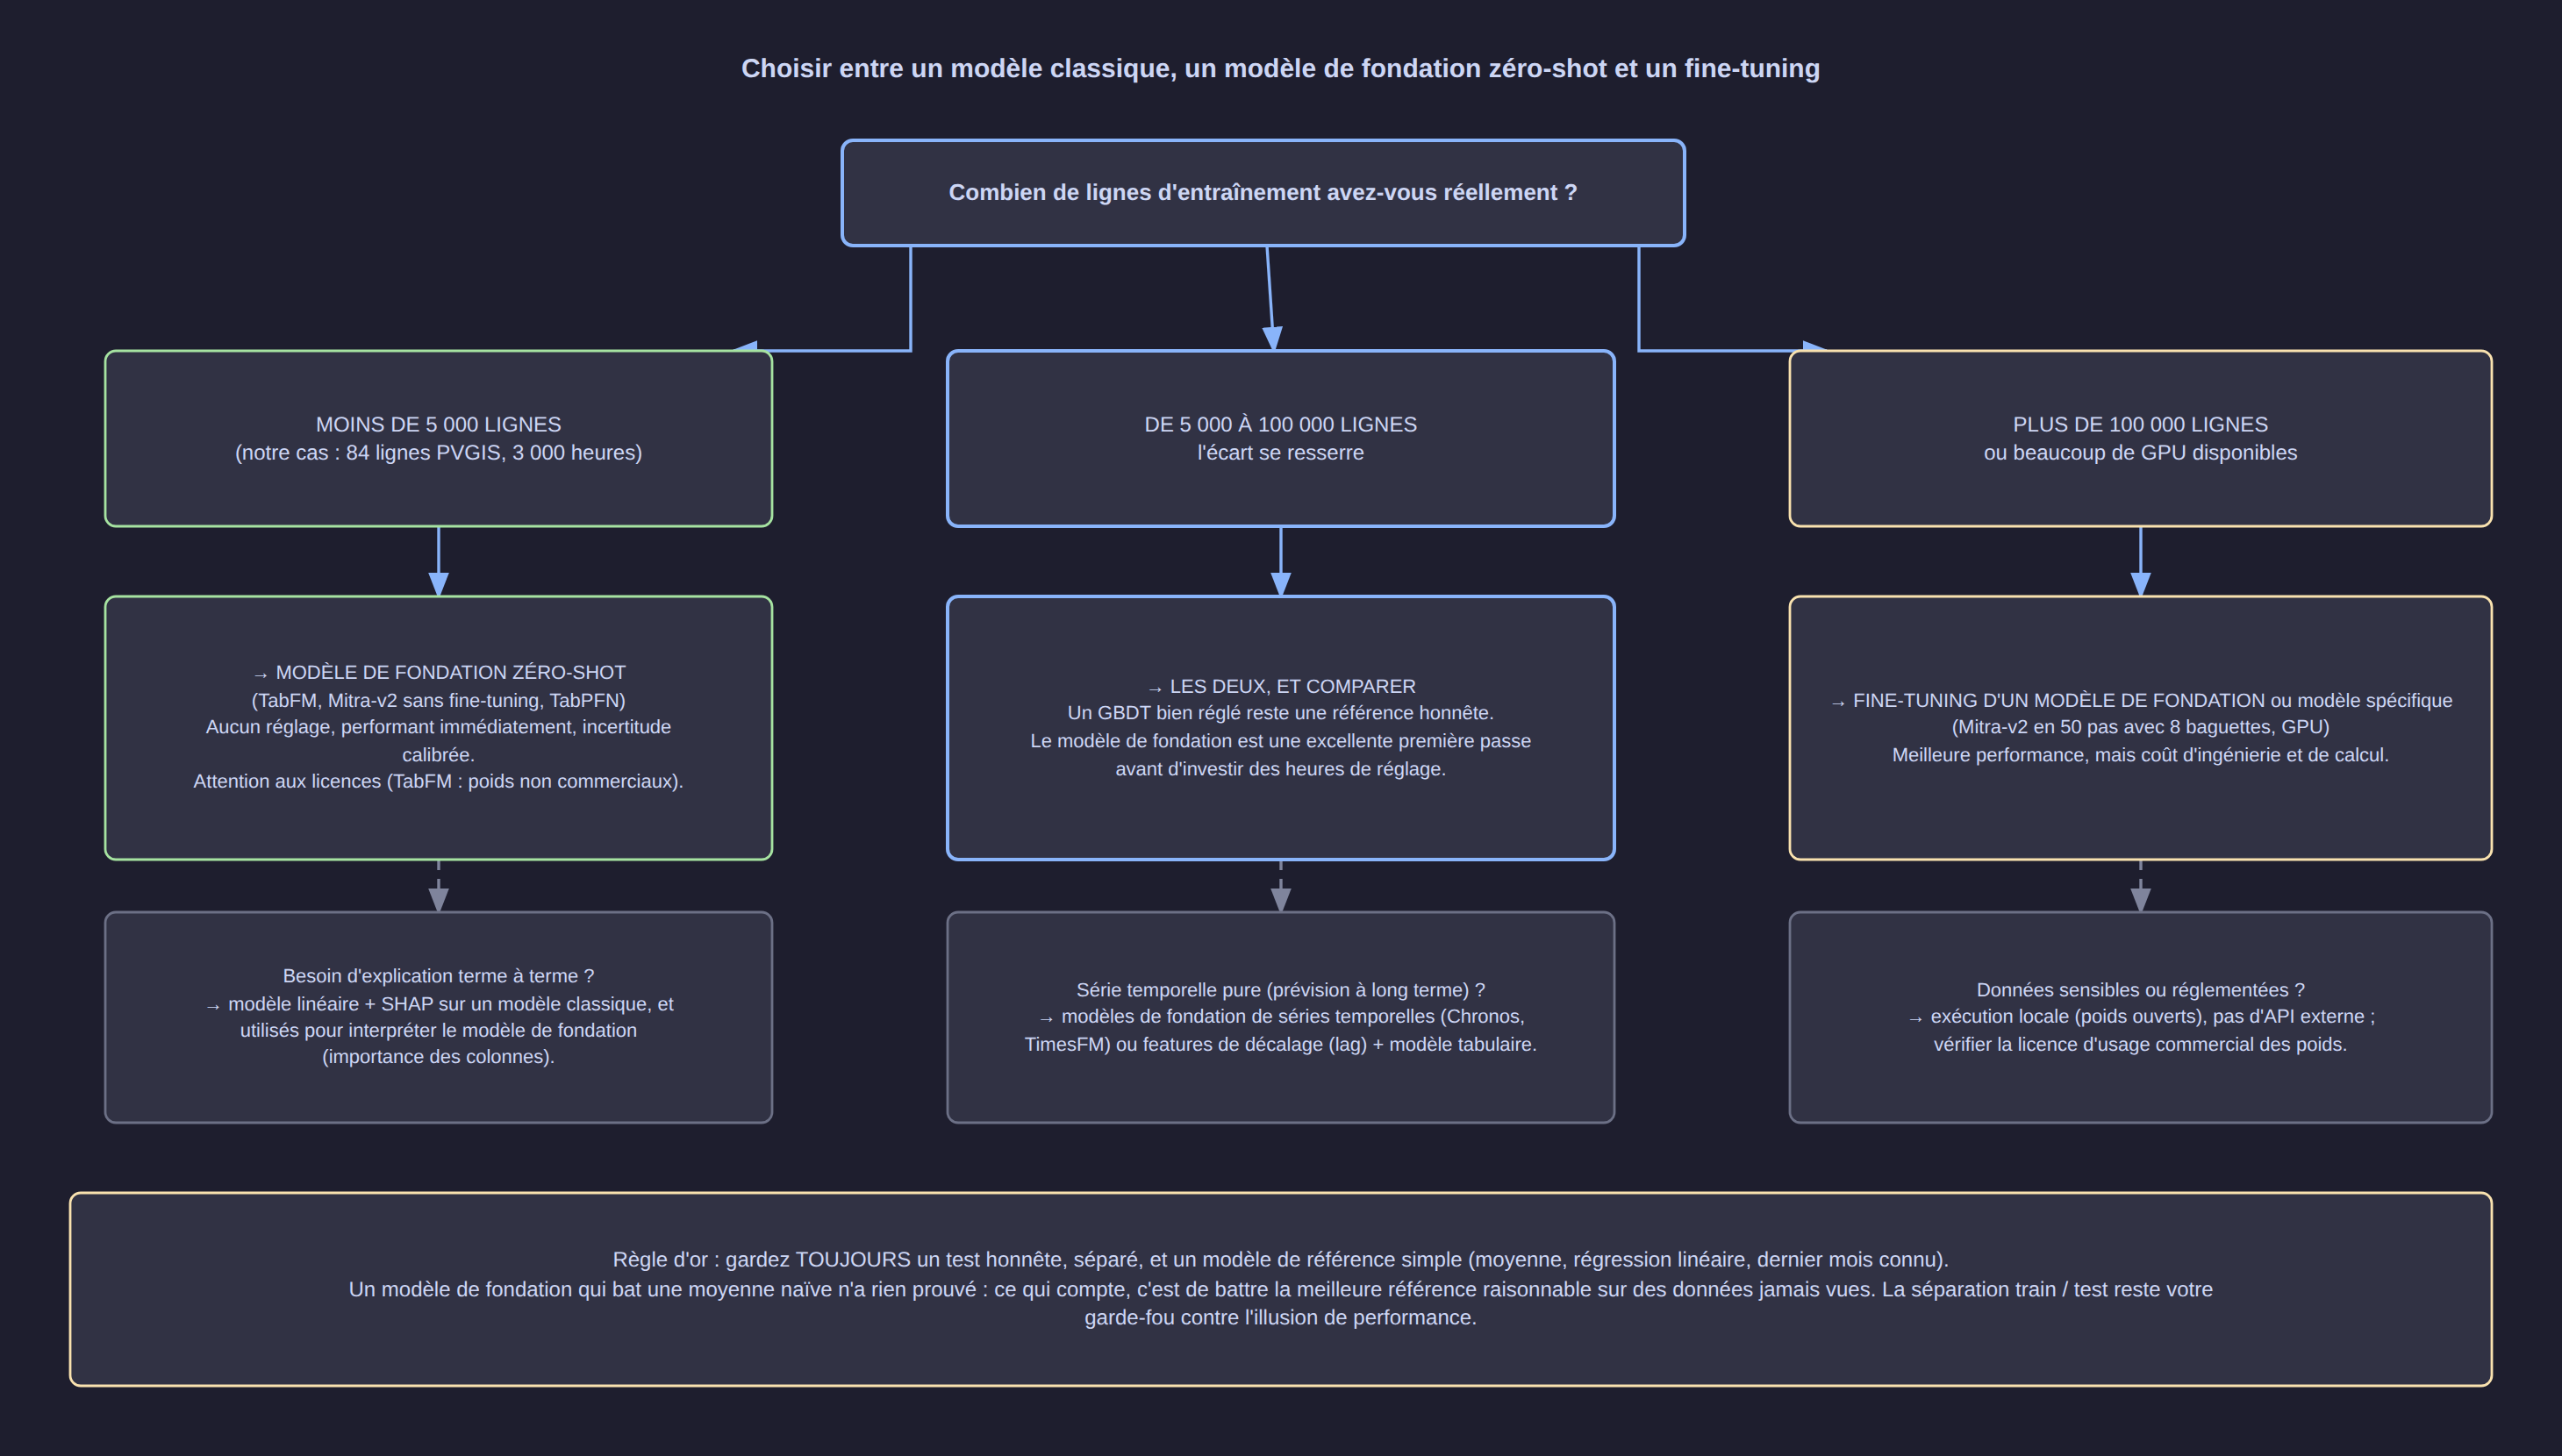
- Fewer than a few thousand rows (our case) → a zero-shot foundation model is relevant: effective immediately, uncertainty often better calibrated, zero tuning.
- Between a few thousand and a few hundred thousand rows → do both and compare: a well-tuned boosted tree remains a formidable baseline.
- Large volumes or production constraints → fine-tuning a foundation model (see the article on Amazon Mitra-v2) or a specific model, trained on your domain.
- Pure time series (forecasting the production of the next 30 days) → foundation models dedicated to time series, or lag variables + a tabular model (our experiment B).
8. Limits and pitfalls to know
- A foundation model is not proof. It gives a fast first answer that is often good; it does not remove the need for a separate, honest test set.
- Context costs memory. These models pass all your training rows at every prediction: memory consumption grows with the number of rows. It is made for small and medium data, not for millions of rows.
- Licences. TabFM: non-commercial weights. Recent TabPFN: licence acceptance and API key. Mitra-v2: Apache-2.0 (weights, inference code, fine-tuning code).
- Synthetic data is a choice, not a detail. The model learns the regularities of its priors: a very particular domain (exotic industrial sensors, text, images) remains outside its terrain.
- A "mean" baseline can mislead. On data as structured as 84 rows of solar production, a deterministic curve already does a large part of the work: the model's merit is to come close to it without tuning, not to work magic.
9. Reproducing the experiment
The scripts of this study follow a simple order:
1. fetch_solar_data.py   → downloads NASA POWER (hourly) and PVGIS (monthly) for 7 regions
2. build_dataset.py      → builds the hourly dataset (8,760 rows), the consumption model,
                           the battery/grid balance and the sizing scenarios
3. run_experiment.py     → experiments A, B, C (naive baselines, classic models, zero-shot TabPFN)
4. export_site_data.py   → publishes the data and results as JSON for the web portal
The data and the interactive charts are published on data-science.pauldiop.com, and the
source files of each diagram (.drawio) accompany this article: click on a diagram to open
it large, then edit the corresponding .drawio.
10. Key takeaways
- A tabular foundation model is pre-trained on millions of synthetic tables: it predicts your data by putting it in the context, with no training and no tuning.
- On 84 rows or 1,500 hours, this type of model is directly usable — which leaves time for the part that really matters: formulating the right business question.
- For a house in Sokone, most of the gain comes from the production + battery pairing, not from oversizing: 1.5 kWp + 5 kWh are enough to cover a consumption of 3.8 kWh/day at more than 97%.
- The real saving is read on the SENELEC bracket (82 FCFA/kWh in 2026 for the first 150 kWh per month): solar replaces a modest bill — to be compared with the installation quotation.
Resources
- Model card and code: Google TabFM (GitHub) and weights on Hugging Face
- Google Research announcement: Introducing TabFM
- Model used in the experiment: TabPFN (Prior Labs)
- Solar data: NASA POWER and PVGIS (JRC)
- Electricity tariffs: SENELEC tariff grid applicable from 1 January 2026 (CRSE)
- Companion article: Amazon Mitra-v2 — Tabular Foundation Models and Fine-Tuning